21 Feb Pearson and Spearman Correlations
In this post we will discuss about correlation coefficients. These metrics are very important in the modeling process since they can help you understand the relationships between continuous and/or ordinal variables. However, there are some caveats that we will explain shortly.
Correlation
Correlation is a coefficient that is used to measure the mutual relationship between two variables. Specifically, it highlights the extent to which two variables change with same way (i.e. increasing or decreasing together). If correlation is found to be positive, then the two variables are increasing or decreasing together. Alternatively, if correlation is negative, then when the one variable increases, the other decreases and vice versa.
Pearson
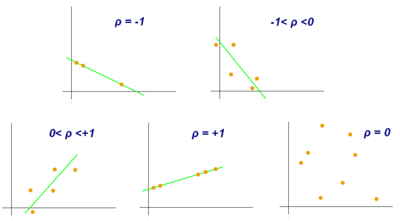
Pearson coefficient measures the linear relationship between two coefficients. For example, when two variables increase or decrease at a constant rate and concurrently then the two variables are positively related and the pearson coefficient is also positive. The pearson coefficient usually is denoted with the letter r. Below there are some examples of different relationships between variables and their pearson coeffiecient:

Spearman
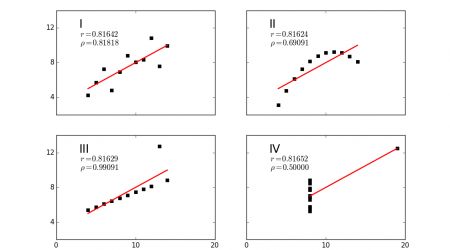
Spearman is a coefficient for measuring the relationship between two continuous or ordinal variables. Here, the difference between the pearson coefficient is that it measures the monotonic and not the linear relationshipa between two variables. In a monotonic relationship, two variables can increase or decrease simultaneously but not at a constant rate. The spearman correlation usually is denoted with the Greek letter ρ (rho). Below there are some examples of pearson and spearman correlations:

Which one to use?
Clearly, both spearman and pearson coefficients are used to uncover relationships between two variables. However, if we suspect that the variables have a linear relationship then it is better to use the pearson coefficient instead of the spearman. Also, pearson coefficient, apart from the linearity in the data assumes constant variance. If for whatever reason this is not the case for our two variables then it is better to use the spearman coefficient. Spearman is a more flexible metric and looks for monotonic relationships, not necessarily linear. Of course when we want to find relationships between data we should not stick to these metrics alone. A scatter plot for example is an easy and straightforward way to detect linear and nonlinear relationships that cannot be captured by spearman and perason coefficients.


Sorry, the comment form is closed at this time.