20 Dec Checking for Stationarity in Time Series
In this post you will learn the steps to take in order to decide whether a time series is stationary or not. Through this practical example, it will become clearer the definiotion we gave in the previous post about stationarity.
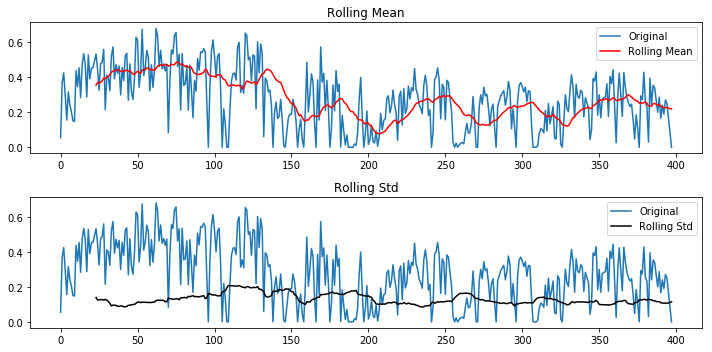
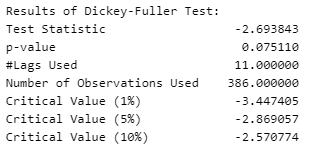
In the next image we draw the original time series together with its rolling mean and rolling variance. Also, we execute the Dickey Fuller test in order to check statistically the stationarity.

Inspecting the graph, we can see some considerable fluctuations of the rolling mean and variance across time, which indicates possible violation of stationarity. Also, the results of the DF test show that since the test statistic is larger than the corresponding test statistic in 95% confidence interval the stationarity might be violated. Therefore we can conclude that the stationarity is indeed violated.

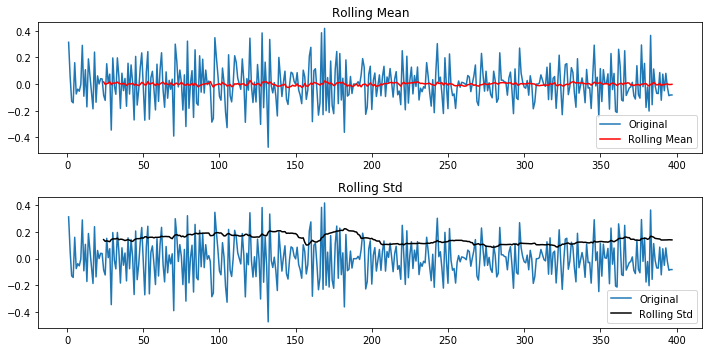
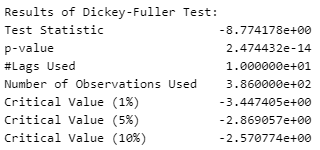
For some statistical forecasting models such as ARIMA models, in order to determine the order of its components, the time series must be transformed to stationary. An easy way to do this is through differencing which essentially is that the values of the tranformed time series is taken by the original by subtracting the next value from the previous one. The result of this differencing can be shown below:

It is clear that the transformed time series is smoother with significantly less fluctuations in the moving average and variance. Also, the Dickey Fuller test is much more confident to decide whether the transformed series is stationary or not.


Sorry, the comment form is closed at this time.