05 Dec Basic Concepts in Time Series Analysis (Part-2)
This post is the second part of a series of tutorials regarding time series analysis.
Traditional methods of time series analysis are concerned with the decomposition of the time series into four main components; Trend, Cyclical, Seasonal and Irregular components.
Trend is the tendency of the time series to increase, decrease or remain stable over a period of time. In other words, trend is the long-term movement of the time series. For example, we may observe increasing values and upward trend in the demand of ice-creams during warmer months and lower demand and thus, downward term in the colder periods.
Seasonality is variations over a fixed and known period. This interval could be annual, monthly, weekly, daily etc. For example, sales of coats are increased during winter months and decreased elsewhere. Some factors causing seasonality might be temperature and climate conditions, income and overall shape of the economic environment, etc. Seasonal variations are important component for time series modeling and should be taken into account when building such models.
A cyclic pattern exists when data exhibit rises and falls that are not of fixed period. The duration of these fluctuations is usually of at least 2 years.
Irregular component is related to highly random fluctuations with no certain patterns. These variations are caused by random incidents such as wars, economic recession, floods, etc.
Although seasonality and cyclic behavior might seem similar, they are actually quite different. If the fluctuations are not of fixed length then they exhibit cyclicality. If the period remains unchanged and associated with some aspect of the calendar, then the pattern is seasonal.

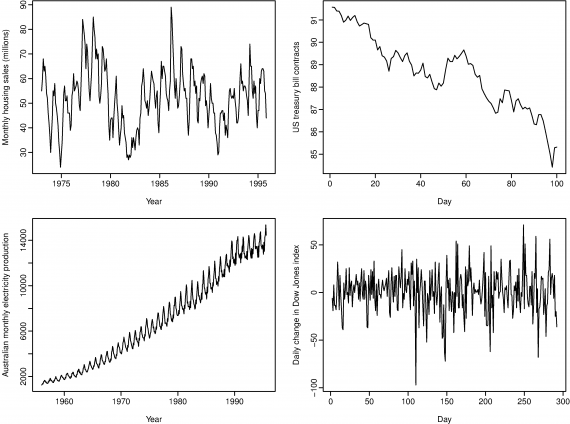
The top left graph (monthly housing sales) exhibits strong annual seasonality and 6-year cyclicality. The top right graph (results from the Chicago market for 100 consecutive trading days) exhibits no seasonality but an obvious downward trend. The bottom left graph (monthly electricity production) shows both seasonality and upward trend. The bottom right graph (daily change in the Dow Jones index) is white noise and has no trend and seasonality and exhibits high irregularity.
In this link you can find the first part of the series discussing about time series analysis.


Sorry, the comment form is closed at this time.